| Info | ||
|---|---|---|
| ||
Work In Progress – Please pardon my mess! |
This is the parent page for (exploratory-oriented) analysis efforts done on the Open Georgia (Transparency in Government) website; http://www.open.georgia.gov/.
...
For this analysis effort, the Hortonworks Sandbox was utilized. Specifically, version 2.0 was utilized, but every effort, but testing was not done, to ensure the code will run on the 1.3 and 2.1 versions as well.
We can then just upload the file via Hue to /user/hue/something which has the following format.
add table with format and sample data...
We just want to know answer a simple question. Only for the year 2010 and for employees of local boards of education, what is the total number of employees & min/max/average salary for each job title.
For MapReduce, do ...
For Pig, a script such as the following will generate these statistics.
| Code Block | ||||||
|---|---|---|---|---|---|---|
| ||||||
-- load up the base User Defined Function library (piggybank) and get a handle on the REPLACE function
register /user/hue/shared/pig/udfs/piggybank.jar;
define REPLACE org.apache.pig.piggybank.evaluation.string.REPLACE();

-- load the salary file and declare its structure
inputFile = LOAD '/user/hue/vzSeminar/openGeorgia/salaryTravelReport-SMALL.csv'
 using org.apache.pig.piggybank.storage.CSVExcelStorage()
 as (name:chararray, title:chararray, salary:chararray, travel:chararray, orgType:chararray, org:chararray, year:int);

-- loop thru the input data to clean up the number fields a bit
cleanedUpNumbers = foreach inputFile GENERATE
 name as name, title as title,
 (float)REPLACE(salary, ',','') as salary,  -- take out the commas and cast to a float
 (float)REPLACE(travel, ',','') as travel,  -- take out the commas and cast to a float
 orgType as orgType, org as org, year as year;

-- trim down to just Local Boards of Education
onlySchoolBoards = filter cleanedUpNumbers by orgType == 'LBOE';

-- further trim it down to just be for the year in question
onlySchoolBoardsFor2010 = filter onlySchoolBoards by year == 2010;

-- bucket them up by the job title
byTitle = GROUP onlySchoolBoardsFor2010 BY title;

-- loop through the titles and for each one...
salaryBreakdown = FOREACH byTitle GENERATE
 group as title, -- we grouped on this above
 COUNT(onlySchoolBoardsFor2010), -- how many people with this title
 MIN(onlySchoolBoardsFor2010.salary), -- determine the min
 MAX(onlySchoolBoardsFor2010.salary), -- determine the max
 AVG(onlySchoolBoardsFor2010.salary); -- determine the avg

-- guarantee the order on the way out
sortedSalaryBreakdown = ORDER salaryBreakdown by title;

dump sortedSalaryBreakdown;
-- save results back to HDFS
--STORE sortedSalaryBreakdown into '/user/hue/vzSeminar/openGeorgia/titleBreakdownForSchoolsIn2010.txt'; |
Sample output. UPDATE IT WITH FULL DATA VALUES!!
| Code Block | ||
|---|---|---|
| ||
(ADAPTED PHYS ED TEACHER,4,24349.45,64689.09,43712.0302734375)
(ADULT EDUCATION DIRECTOR/COORD,3,1033.6,74164.01,37078.07238769531)
(ADULT EDUCATION TEACHER,9,3002.0,52424.72,16903.59646267361)
(ASSISTANT PRINCIPAL,38,6243.25,100989.04,77926.6794819079)
(ATTENDANCE WORKER,1,7742.09,7742.09,7742.08984375)
(AUDITOR,1,83317.92,83317.92,83317.921875)
(BOOKKEEPER,11,10650.44,33484.04,26734.2587890625)
(BUS DRIVER,49,767.68,50915.81,20278.801754075655)
(BUSINESS SERV SECRETARY/CLERK,26,789.99,72080.0,26443.907658503605)
(CENTRAL SUPPORT CLERK,1,23392.33,23392.33,23392.330078125)
(CONSTRUCTION MANAGER,1,33890.67,33890.67,33890.671875)
(CROSSING GUARD,13,528.09,5384.09,3670.4876755934497)
(CUSTODIAL PERSONNEL,132,3803.52,46626.88,26624.915542140152)
(DEPUTY/ASSOC/ASSISTANT SUPT,2,108993.76,161051.34,135022.55078125)
(DIAGNOSTICIAN,4,59711.15,69417.72,65523.5888671875)
(DIRECTOR OF CURRICULUM/INSTR,6,31162.52,188324.23,98002.13346354167) |
With Hive, tons easier still!!
...
| language | text |
|---|---|
| title | TitleBreakdownForSchoolsIn2010.hql |
...
To get started, just load the salaryTravelReport.csv file that you create (or simply download) from the instructions in Preparing Open Georgia Test Data into HDFS itself. For the examples provided, log into the Sandbox's Hue UI as the user hue and from the File Browser create an opengeorgia folder within /user/hue and then upload the file. You should see something similar to the following once that is done.
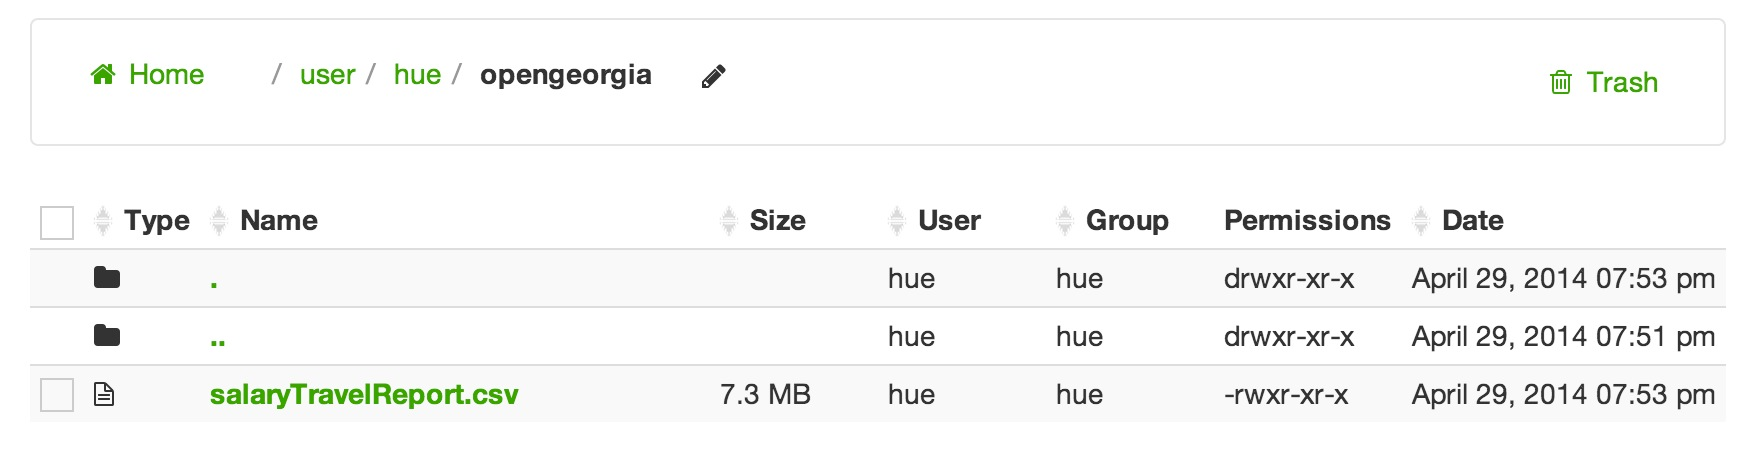
Now, we've got some data and are ready to answer the following question as a simple, figurative, example of what kinds of analysis could be done.
|
|---|
As for which tools to use, the following list of blog entries (if they are not linked, they are coming soon) presents varying tool options to address questions such as this.
- use mapreduce to calculate salary statistics for georgia educators (first of a three-part series)
- use pig to calculate salary statistics for georgia educators (second of a three-part series)
- use hive to calculate salary statistics for georgia educators (third of a three-part series)
- use spark to calculate salary statistics for georgia educators (the fourth book of the trilogy)