use pig to calculate salary statistics for georgia educators (second of a three-part series)
 In this the second installment of a three-part series, I am going to show how to use Apache Pig to solve the same Simple Open Georgia Use Case that we did in use mapreduce to calculate salary statistics for georgia educators (first of a three-part series), but this time I'll do it with a lot less code. Pig is a great "data pipelining" technology and our simple need to parse, filter, calculate statistics, sort, and then save the Format & Sample Data for Open Georgia is right up its alley.
Be sure to check out the write-up at Open Georgia Analysis to ensure you have the right context before going on in this posting. This will drive you to Preparing Open Georgia Test Data to help you generate (or just download) a sample dataset to perform analysis on. You will also want to make sure you have a working copy of the Hortonworks Sandbox to do your testing with.
The Pig code is also in the GitHub > lestermartin > hadoop-exploration project and the script itself can be found at TitleStatisticsForSchoolsIn2010.pig. To replace the five classes described in the lestermartin.hadoop.exploration.opengeorgia package we used just 10 lines of Pig code as discussed below.
The first two lines are just some housekeeping activities. I often have trouble with Hue's Pig UI and the REGISTER command so as the comments section of create and share a pig udf (anyone can do it) shows, I usually solve this by putting my UDF jars on HDFS itself (including the "piggybank"). You'll see the use of the REPLACE function in a bit.
-- load up the base UDF (piggybank) and get a handle on the REPLACE function
register /user/hue/shared/pig/udfs/piggybank.jar;
define REPLACE org.apache.pig.piggybank.evaluation.string.REPLACE();
Then we simply load the CSV file that we have on HDFS into a structure we defined in-stream. The CSVExcelStorage class is a lifesaver as you can see from SalaryReportBuilder we weren't able to simple tokenize the input based on finding a comma.
-- load the salary file and declare its structure
inputFile = LOAD '/user/hue/opengeorgia/salaryTravelReport.csv'
 using org.apache.pig.piggybank.storage.CSVExcelStorage()
 as (name:chararray, title:chararray, salary:chararray, travel:chararray, orgType:chararray, org:chararray, year:int);
Since there is all kinds of mess in the Salary and Travel Expenses fields, I initially declared them as simple strings. The next line does some light cleanup on these two values so I could cast them as floats. I took out the dollar signs back in my Preparing Open Georgia Test Data notes, but if they were present it would be easy enough to strip them out just like I'm doing with the commas.
-- loop thru the input data to clean up the number fields a bit
cleanedUpNumbers = foreach inputFile GENERATE
 name as name, title as title,
 (float)REPLACE(salary, ',','') as salary,  -- take out the commas and cast to a float
 (float)REPLACE(travel, ',','') as travel,  -- take out the commas and cast to a float
 orgType as orgType, org as org, year as year;
The next three pipelining statements just toss out those records that don't meet the criteria of the Simple Open Georgia Use Case and the lump up all the data by the job title – very synonymous to what we explicitly did in use mapreduce to calculate salary statistics for georgia educators (first of a three-part series) with our TitleMapper class.
-- trim down to just Local Boards of Education
onlySchoolBoards = filter cleanedUpNumbers by orgType == 'LBOE';

-- further trim it down to just be for the year in question
onlySchoolBoardsFor2010 = filter onlySchoolBoards by year == 2010;

-- bucket them up by the job title
byTitle = GROUP onlySchoolBoardsFor2010 BY title;
Now we get down to the brass tacks of actually calculating the statistics we've been after. The built-in functions make that easy enough.
-- loop through the titles and for each one...
salaryBreakdown = FOREACH byTitle GENERATE
 group as title, -- we grouped on this above
 COUNT(onlySchoolBoardsFor2010), -- how many people with this title
 MIN(onlySchoolBoardsFor2010.salary), -- determine the min
 MAX(onlySchoolBoardsFor2010.salary), -- determine the max
 AVG(onlySchoolBoardsFor2010.salary); -- determine the avg
Truthfully, this final "do something" bit of code looks a lot like snippet below from SalaryStatisticsReducer that we built in use mapreduce to calculate salary statistics for georgia educators (first of a three-part series).
        for(FloatWritable value : values) {
            float salary = value.get();
            numberOfPeopleWithThisJobTitle++;
            totalSalaryAmount = totalSalaryAmount + salary;
            if(salary < minSalary)
                minSalary = salary;
            if(salary > maxSalary)
                maxSalary = salary;
        }
Then we quickly make sure the output will be sorted the way we want it.
-- guarantee the order on the way out
sortedSalaryBreakdown = ORDER salaryBreakdown by title;
Lastly, line 10 writes the output file into HDFS. There's a commented out alternative that simply displays the contents to the console (be it Hue in our case or the CLI if you're running the script that way).
-- dump results to the UI
--dump sortedSalaryBreakdown;

-- save results back to HDFS
STORE sortedSalaryBreakdown into '/user/hue/opengeorgia/pigoutput';
The following bit of confirmation log information was easy enough to get to from Hue's Pig UI.
2014-04-30 04:35:01,442 [main] INFO  org.apache.pig.backend.hadoop.executionengine.mapReduceLayer.MapReduceLauncher - 100% complete
2014-04-30 04:35:01,532 [main] INFO  org.apache.pig.tools.pigstats.SimplePigStats - Script Statistics:

HadoopVersion	PigVersion	UserId	StartedAt	FinishedAt	Features
2.2.0.2.0.6.0-76	0.12.0.2.0.6.0-76	yarn	2014-04-30 04:33:29	2014-04-30 04:35:01	GROUP_BY,ORDER_BY,FILTER

Success!

Job Stats (time in seconds):
JobId	Maps	Reduces	MaxMapTime	MinMapTIme	AvgMapTime	MedianMapTime	MaxReduceTime	MinReduceTime	AvgReduceTime	MedianReducetime	Alias	Feature	Outputs
job_1398691536449_0085	1	1	7	7	7	7	4	4	4	4	byTitle,cleanedUpNumbers,inputFile,onlySchoolBoards,salaryBreakdown	GROUP_BY,COMBINER
job_1398691536449_0086	1	1	4	4	4	4	3	3	3	3	sortedSalaryBreakdown	SAMPLER
job_1398691536449_0087	1	1	4	4	4	4	3	3	3	3	sortedSalaryBreakdown	ORDER_BY	/user/hue/opengeorgia/pigoutput,

Input(s):
Successfully read 76943 records (7613119 bytes) from: "/user/hue/opengeorgia/salaryTravelReport.csv"

Output(s):
Successfully stored 181 records (11278 bytes) in: "/user/hue/opengeorgia/pigoutput"

Counters:
Total records written : 181
Total bytes written : 11278
Spillable Memory Manager spill count : 0
Total bags proactively spilled: 0
Total records proactively spilled: 0
It confirms that same in/out counts that we saw in use mapreduce to calculate salary statistics for georgia educators (first of a three-part series); 76,943 input records and 181 output records. Here's a snapshot of what the output file looks like from Hue's File Browser.
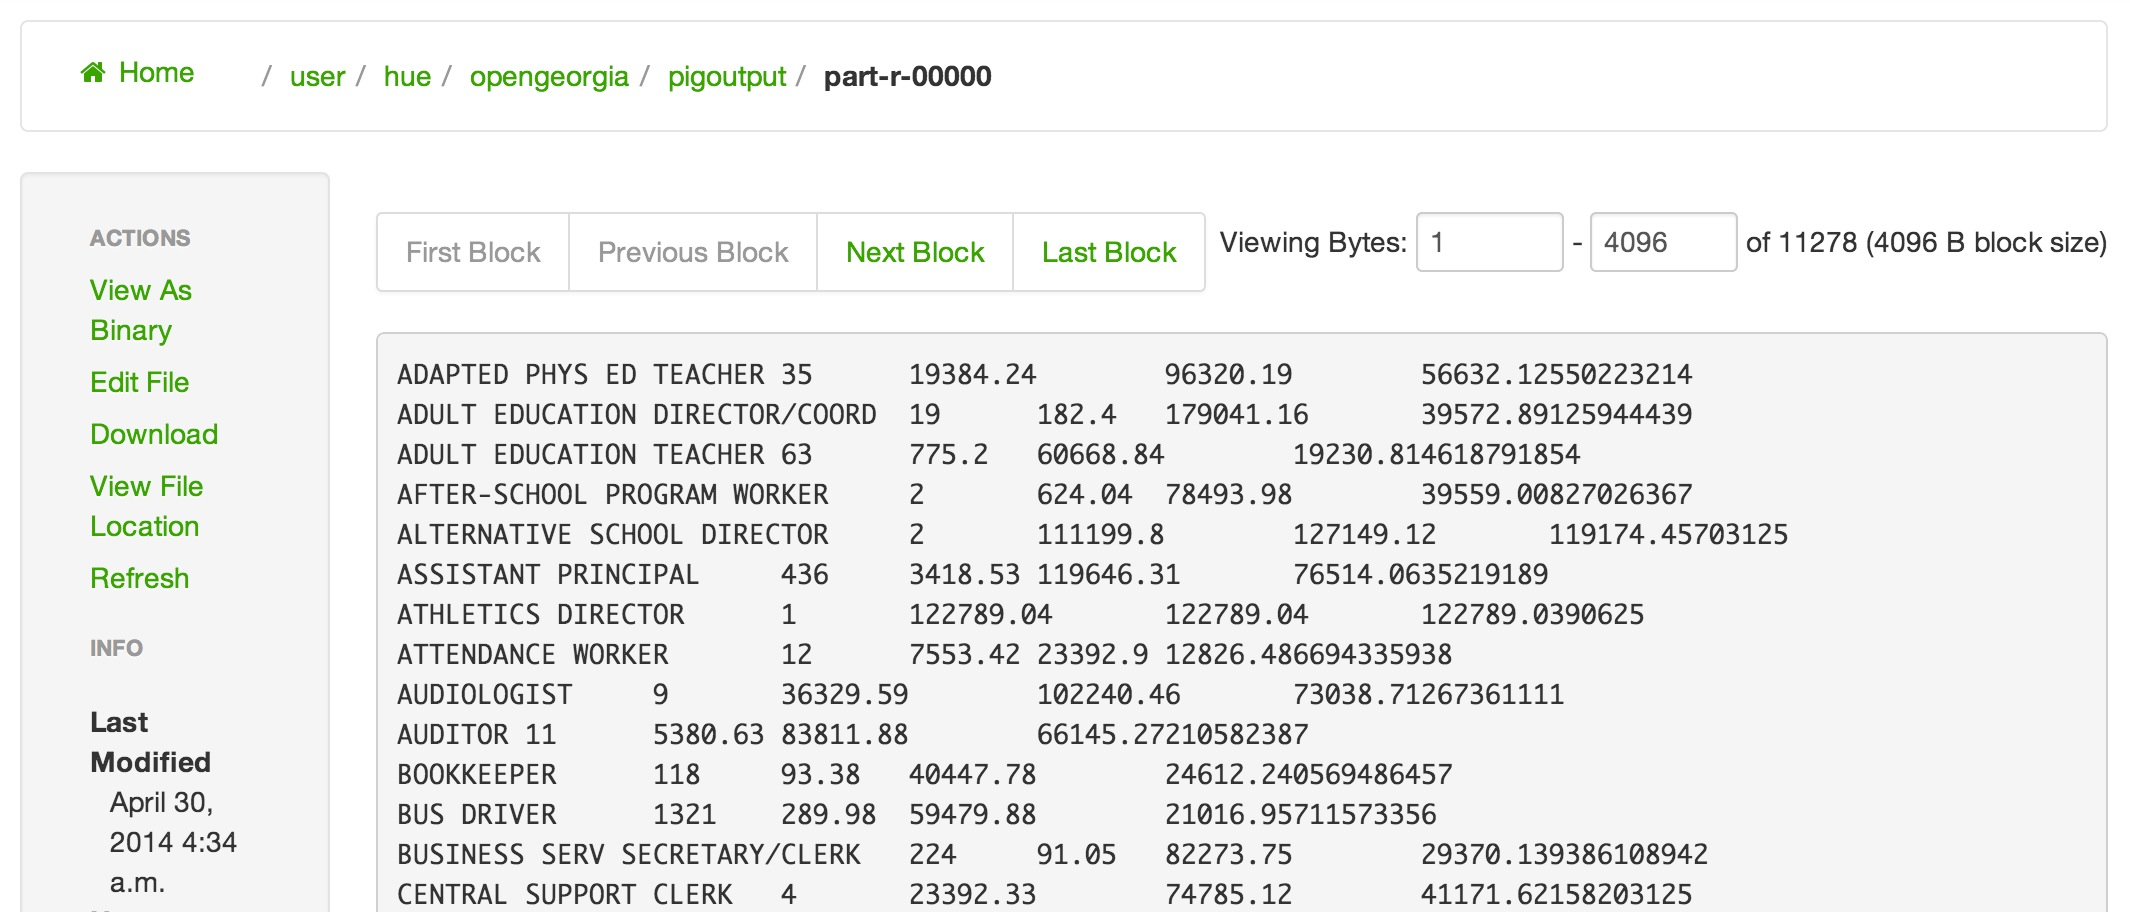
As before, we were able to answer the Simple Open Georgia Use Case question. Just as important, a close look at the output between this solution and the MapReduce one showed the spot-check values of the average salary for the 9 Audiologists is consistent at $73,038.71 (see above screenshot) as well as both correctly indicating that the highest paid 3rd Grade Teacher from this dataset is making $102,263.29.
The default answer for consulting is "it depends" is the same answer for questions about Hadoop. When you put those together then the resounding answer for Hadoop consulting is "IT DEPENDS", but I do feel for this particular Simple Open Georgia Use Case using the Format & Sample Data for Open Georgia that Pig is a better solution than Java MapReduce. That surely won't be the case always, but the simplicity of this Pig script surely makes it the winner for this situation when only looking at these two options. We'll just have to wait and see if the final installment of this series declares Hive an even better alternative than Pig to this problem.